Framer Marketplace Analytics: which template earns the next day of work?
Sima editorial · 11 November 2026 · Analysis · Release announced 25 September 2026
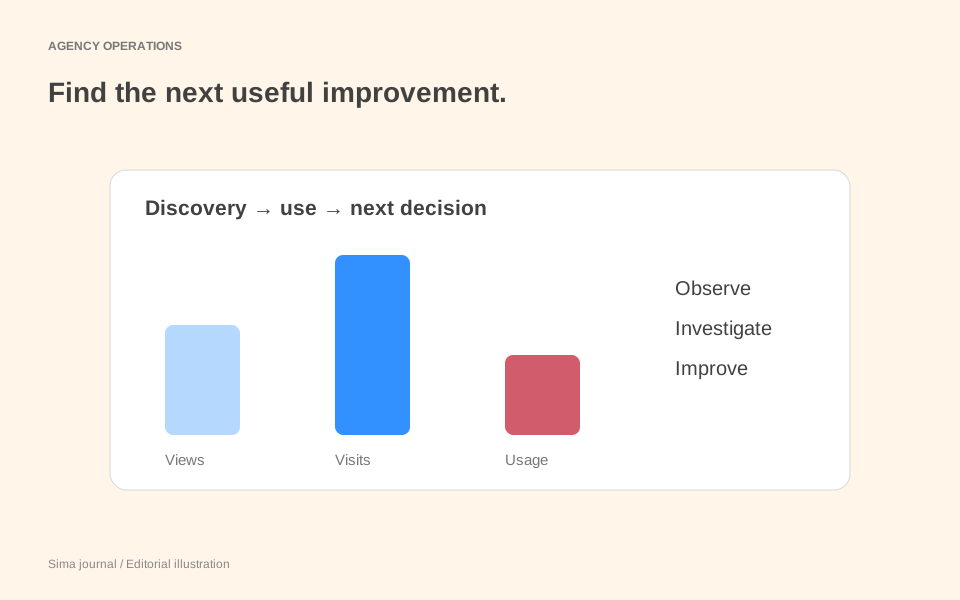
Framer’s Marketplace Analytics helps a studio examine what happens after a template listing attracts attention. For an agency dividing its week between client projects and products, that can inform a practical decision: which template deserves the next day of work?
The 25 September 2026 release introduced a Performance tab bringing together visitors, views and usage, plus Rankings showing resources across the Marketplace and within categories. Framer also updated its ranking algorithm to respond sooner to performance changes. The business opportunity is to use those signals to allocate maintenance and development time, rather than treating each resource as a launch that is finished once it goes live.
Read the labels before making a business case
Framer’s analytics guide distinguishes unique visitors from views, which include repeat visits. Usage measures depend on the resource type and include remixes, opens and installs. Template conversions count remixed projects that upgrade to a paid Framer plan; they do not count template purchases.
That last distinction matters when presenting a monthly product report. A studio needs its own sales records to answer revenue questions. Keep the Marketplace figures alongside those records with their original labels, so a promising product signal does not become an unsupported claim about money earned.
Two templates, one available Friday
Consider a fictional two-person studio selling a photographer portfolio and a consultancy template. The portfolio attracts more views. The consultancy template attracts fewer views but repeatedly appears in support enquiries about adding a second service or changing a case-study layout. Both could plausibly benefit from more work.
The tempting move is to refresh the portfolio’s hero animation: it is visible, enjoyable and easy to share. Instead, the studio examines what each proposed improvement would actually solve.
For the portfolio, imagine views have increased while remixes remain broadly unchanged. The studio inspects its demo and notices that every example uses unusually strong, carefully cropped photography. Its intended buyers may have uneven image collections. This is a hypothesis about the audience, not a diagnosis supplied by the graph. A useful next step would be to show the same layout with a realistic mix of portrait, landscape and lower-resolution work, then invite existing customers to explain what was unclear before buying.
For the consultancy template, the repeated questions point towards a different task. The studio could add one fully worked example of a second service, showing how it connects to navigation and related case studies. That intervention has a direct operational purpose: make a common customer job easier and reduce the need to explain it individually.
The decision comes down to the studio’s current constraint. If support is interrupting paid client work, the consultancy example may be the better Friday investment even though the portfolio receives more attention. If support is manageable and the studio wants to reach new buyers, investigating the portfolio’s presentation may deserve priority. Analytics makes the choice more informed; the studio’s economics determine which problem matters most.
Give rankings a specific job
Use rankings to compare relative performance, then return to the resource’s own results. Framer’s ranking guidance describes several inputs: discovery, usage, continued use and the percentage of remixed templates upgrading to a paid plan. A resource can improve while falling behind stronger competitors. Trending responds to momentum; Best favours sustained performance over the selected period. Framer keeps the exact formula private.
For the fictional studio, a portfolio climbing a category list is a reason to check that its demo and documentation can handle new interest. It is not a reason to abandon the consultancy product. Conversely, a fall in position does not establish that an editorial change failed. Keep the reporting period and absolute activity visible when discussing either result.
Maintain a catalogue with a purpose
A useful catalogue review ends with an allocation of time. Record the problem, the proposed change, the date and the evidence that would justify further investment. For the consultancy template, that might mean comparing subsequent support topics with the earlier pattern. For the portfolio, it might mean revisiting views and remixes after the new demonstration has had time to attract an audience. Neither comparison establishes causation on its own, but both are more informative than remembering whether launch week felt busy.
Also decide what each product is for. A template sold as a standalone product needs a different support budget from one that introduces buyers to a custom design service. Our Framer Experts analysis considers that services side of the business; our Agent Templates article examines another direction for template development.
The strongest use of Marketplace Analytics is a better next commission to yourself: one resource, one customer problem and a clear reason to spend the time.
Source and scope
Based on Framer’s release announcement and analytics guidance, reviewed 8 November 2026. The studio and its activity patterns are illustrative. No creator account, sales data or product testing was used.